
Interpreting Performance across Different Time Aggregations
By Kelsey Fenerty, STR
When reporting, writing and presenting on data, STR analysts frequently switch between four different time aggregations: monthly, running three month, running 12 month and year-to-date. Aggregations can produce different results, which can lead to confusion about which is best to use (answer: it depends!). The uses and interpretation of each time configuration are detailed below, along with a look at the Amsterdam hostel market as an example.
Monthly Data
As its name suggests, monthly data is a view of a given month’s performance. Monthly data is inherently seasonal: due to weather, school break schedules, holidays, events and calendar shifts, the data may spike in some months and fall in others, irrespective of actual market performance. Year-over-year monthly data is best viewed one month at a time in comparison to a hostel’s market or competitive set.
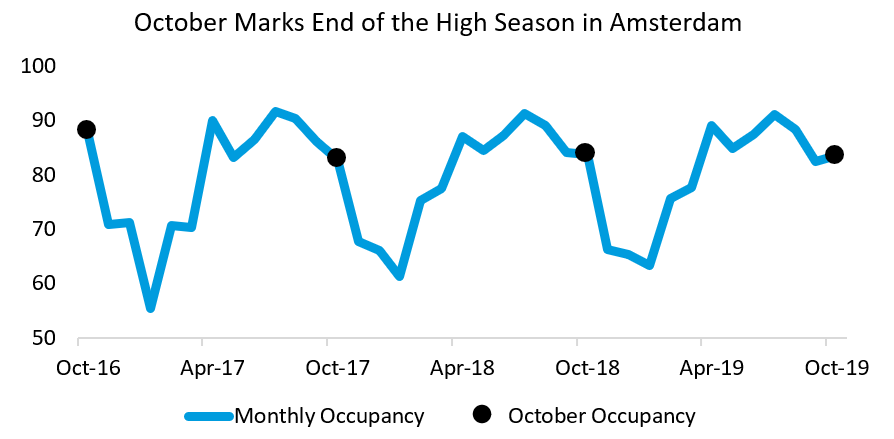
A time trend highlights seasonality in Amsterdam occupancy. While market occupancy peaks in July, it remains high through October before declining precipitously as the weather cools. From October to November, occupancy falls an average of 17 percentage points, the largest month-to-month decline all year. Amsterdam hostel occupancy fell 0.2% year-over-year in October, marking the fourth straight month of year-over-year declines.
Running Three Month Data
Running three month (R3) data is the average of performance over the past three months. R3 data is most useful at quarter or season end, as a way of measuring performance over a small subset of time. Running three month data is best viewed as a bar chart rather than a time trend, as it lags but doesn’t erase seasonality in data.
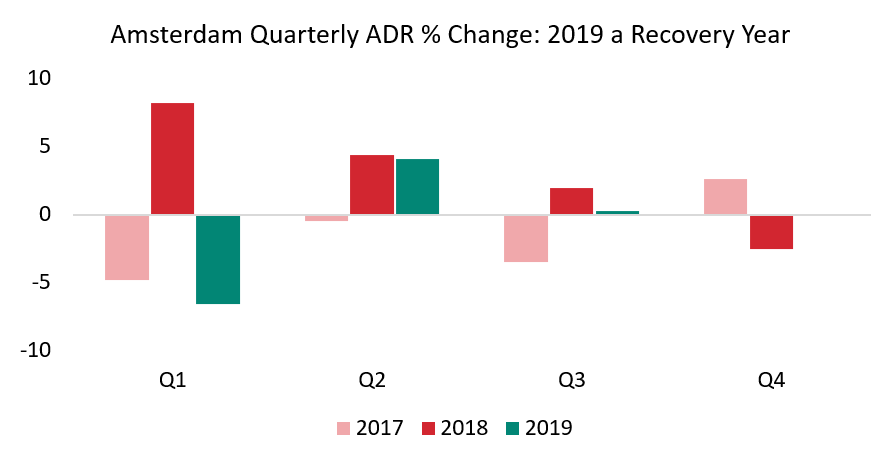
Quarterly ADR growth in Amsterdam visualizes the pitfalls of an amazing year, which the market experienced in 2018. The following year is what STR refers to as “hard comp”; performance was so good in 2018 that even normal performance in 2019 looks poor in comparison. Q4 should yield interesting results, as it was the only quarter to see ADR decline in 2018, which should make growth in 2019 easier to come by on a year-over-year comparative basis.
Running 12 Month Data
If R3 data is the average of data over the past three months, Running 12 Month (R12) or 12 Month Moving Average (12MMA) data is the average of data over the past 12 months. R12 data condenses one year into one number and is most useful for viewing performance trends over time, as it removes seasonality from data.
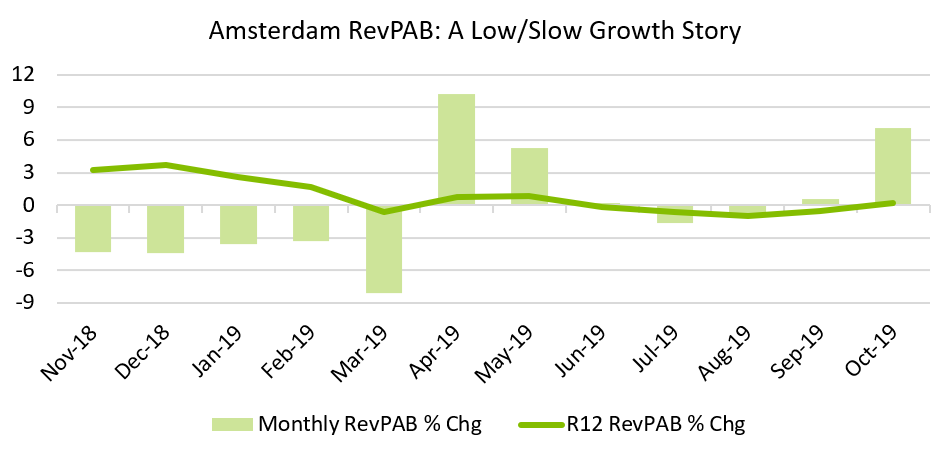
For seven of the past 12 months, Amsterdam RevPAB growth has been near zero, changing year-over-year by less than 1 percent. Contrast this to monthly RevPAB growth, where spikes in March, April, and October make discerning trends difficult.
Year-to-Date Data
The last time aggregation STR uses regularly is year to date (YTD), which is most useful for obtaining the most accurate picture of current year performance. With the exception of December, 12MMA aggregations will include prior year data, and monthly and R3 snapshots won’t capture the full year. YTD data is best used at least four months into the year; prior to that, R3 or monthly data would serve nearly the same purpose.
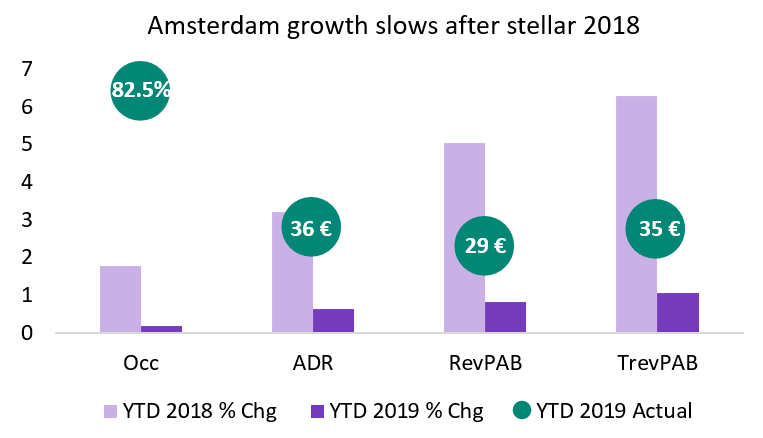
While Amsterdam hostel performance has improved year-over-year in 2019, the growth is modest compared to 2018. Only TrevPAB has grown more than one percent year-over-year. The last two months of the year will be crucial in determining if Amsterdam is able to end 2019 on a high note.
Conclusion
STR’s four time aggregations each serve their own purpose in helping to discern performance. For Amsterdam in particular, all four aggregations suggest 2019 has thus far been a year of low, slow growth, particularly in comparison to robust 2018 performance.
Interested in more?
STR reports on hostel performance in London and Amsterdam and is actively pursuing other markets. Reports are free to data providers. Interested in more information? Please contact Patrick Mayock at pmayock@str.com.
About STR
STR provides clients from multiple market sectors with premium, global data benchmarking, analytics and marketplace insights. Founded in 1985, STR maintains a presence in 15 countries with a corporate North American headquarters in Hendersonville, Tennessee, and an international headquarters in London, England. For more information, please visit str.com.
Join WYSE Travel Confederation
If you’d like to join WYSE Travel Confederation and benefit from new connections, free access to industry research, informative webinar sessions, discounts on industry events and brand exposure within the youth and student travel industry, click below to view our membership options and find out more.
